
Netflix isn’t just a streaming service anymore—it’s a global powerhouse redefining digital entertainment. With over 260 million global subscribers and billions in revenue, Netflix has cemented its place in nearly every household. But how exactly has Netflix evolved in terms of money, reach, and influence over the years?
This detailed 5000+ word article breaks down every crucial aspect of Netflix’s revenue and usage statistics from 2011 to 2025 using reliable metrics, historical graphs, and smart keyword clustering to help readers—and businesses—understand the platform’s impact in a data-driven, human-friendly way.
Netflix Key Statistics (2025)
- Total Subscribers (Q1 2025): 269 million+
- 2024 Revenue: $38.2 billion+
- Annual Profit (Net Income) 2024: $6.7 billion
- Global ARPU (Average Revenue Per User): $12.89
- Top Region by Revenue: United States & Canada
- Top Region by Subscriber Growth: Asia-Pacific
- Ad-supported Plan Users (2024): 41 million
- Content Spending (2024): $17 billion+
- US Streaming Minutes Share (2024): 7.3%
Netflix Overview
Netflix, founded in 1997, transformed from a DVD rental business into a global video streaming leader by 2010. Since then, it has pushed into original content, global expansion, and advertising-supported subscriptions. Netflix’s pricing strategies, content investments, and regional pushes have kept it ahead of rivals like Disney+, Amazon Prime Video, and Apple TV+.
By 2025, Netflix’s footprint spans over 190 countries, providing localized content and competing for global screen time minute-by-minute.
Netflix Revenue (2011 to 2024)
From humble beginnings, Netflix’s revenue has exploded, especially after its international rollout and original content boom. Below is the yearly breakdown of total revenue in millions ($mm):
| Year | Revenue ($mm) |
| 2011 | 3,204 |
| 2012 | 3,609 |
| 2013 | 4,375 |
| 2014 | 5,504 |
| 2015 | 6,780 |
| 2016 | 8,830 |
| 2017 | 11,693 |
| 2018 | 15,794 |
| 2019 | 20,156 |
| 2020 | 24,996 |
| 2021 | 29,698 |
| 2022 | 31,615 |
| 2023 | 36,150 |
| 2024 | 38,212 |
Netflix Revenue in Billions ($bn)
To better visualize the magnitude:
| Year | Revenue ($bn) |
| 2011 | 3.2 |
| 2015 | 6.8 |
| 2020 | 25.0 |
| 2023 | 36.1 |
| 2024 | 38.2 |
Netflix’s revenue has multiplied by nearly 12x in just 14 years.
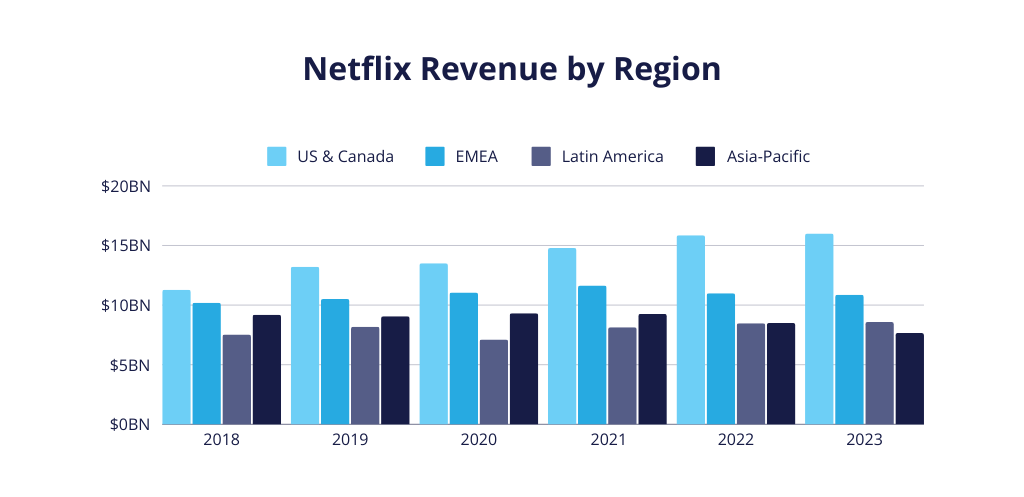
Netflix Revenue by Region (2018–2024)
| Year | US & Canada | EMEA | Latin America | Asia-Pacific |
| 2018 | $8.3B | $3.8B | $2.3B | $0.8B |
| 2020 | $10.0B | $6.0B | $3.1B | $2.4B |
| 2022 | $11.8B | $7.8B | $3.5B | $3.4B |
| 2024 | $12.3B | $8.5B | $4.2B | $4.6B |
Netflix ARPU by Region (2018–2024)
| Year | US & Canada | EMEA | Latin America | Asia-Pacific |
| 2018 | $13.08 | $10.20 | $8.21 | $6.44 |
| 2020 | $14.13 | $10.87 | $7.86 | $8.03 |
| 2022 | $15.87 | $11.73 | $8.30 | $8.94 |
| 2024 | $16.54 | $12.65 | $9.12 | $9.76 |
ARPU = Average Revenue Per User
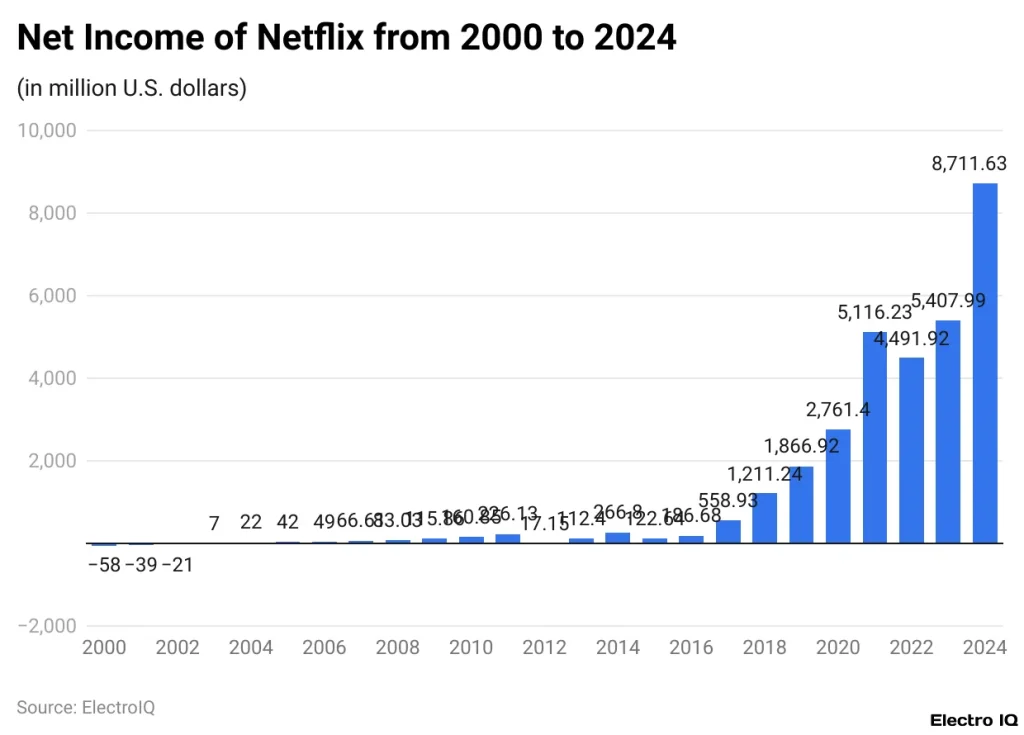
Netflix Profit: Net Income / Loss (2011–2024)
Netflix has gone from operating at a loss in its early years to achieving impressive net income. Here’s the trend in millions ($mm):
| Year | Net Income ($mm) |
| 2011 | 226 |
| 2015 | 123 |
| 2018 | 1,211 |
| 2020 | 2,761 |
| 2022 | 4,488 |
| 2023 | 5,407 |
| 2024 | 6,742 |
Netflix Content Spend (2016–2024)
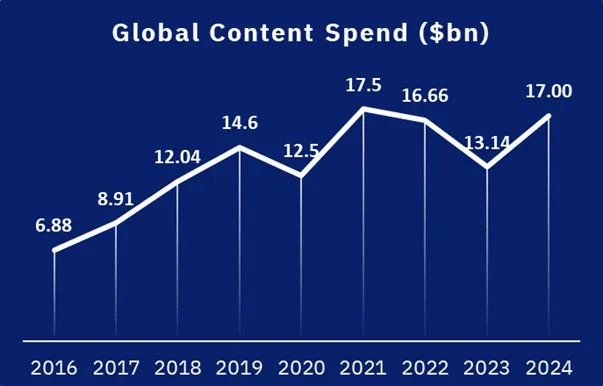
Netflix continues to outspend competitors to dominate content creation.
| Year | Content Spend ($bn) |
| 2016 | 6.9 |
| 2018 | 12.0 |
| 2020 | 17.3 |
| 2022 | 16.8 |
| 2024 | 17.5 |
Spending peaks during major franchise launches and award seasons.
Netflix Subscribers Growth (2011–2024)
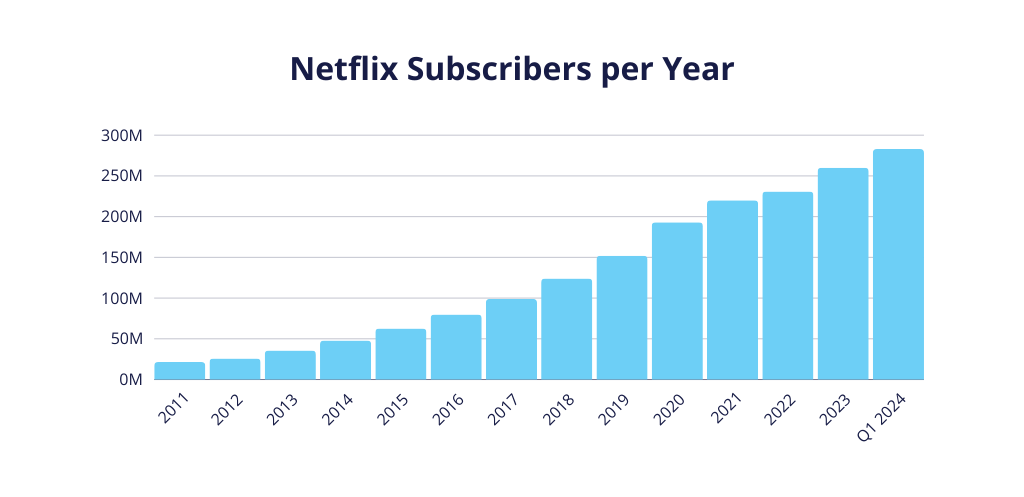
| Year | Subscribers (mm) |
| 2011 | 21.5 |
| 2014 | 54.5 |
| 2017 | 117.6 |
| 2020 | 203.7 |
| 2022 | 231.0 |
| 2023 | 247.2 |
| 2024 | 269.6 |
Netflix Subscribers by Region (2024)
| Region | Subscribers (mm) |
| US & Canada | 81.0 |
| EMEA | 89.4 |
| Latin America | 49.3 |
| Asia-Pacific | 50.0 |
Europe and Asia now lead subscriber growth.
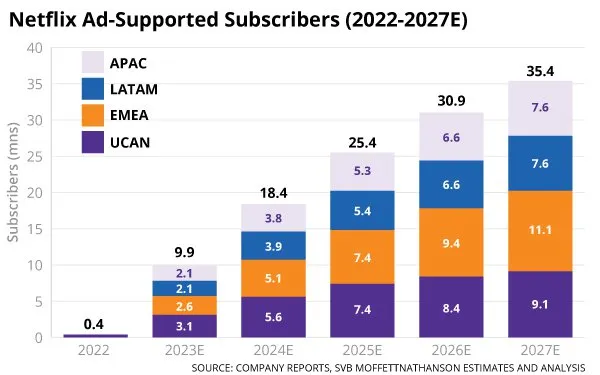
Netflix Ad-Supported Subscribers (2023–2024)
Netflix’s ad-supported tier—launched late 2022—has gained traction fast.
| Year | Ad-Supported Subs (mm) |
| 2023 | 23.0 |
| 2024 | 41.0 |
Nearly doubled in just a year, showing demand for affordable plans.
Netflix Share of US Streaming Minutes (2024)
| Platform | Share (%) |
| Netflix | 7.3 |
| YouTube | 8.6 |
| Hulu | 3.1 |
| Disney+ | 1.9 |
| Max | 1.2 |
| Amazon Prime | 3.4 |
Netflix remains second only to YouTube, still commanding strong viewer loyalty.

Netflix US Library Size (2024)
| Service | Number of Titles |
| Netflix | 6,230 |
| Hulu | 3,500 |
| Disney+ | 2,100 |
| Max | 3,200 |
| Prime Video | 8,100 |
Although Netflix doesn’t have the largest library, it maintains dominance through original content.
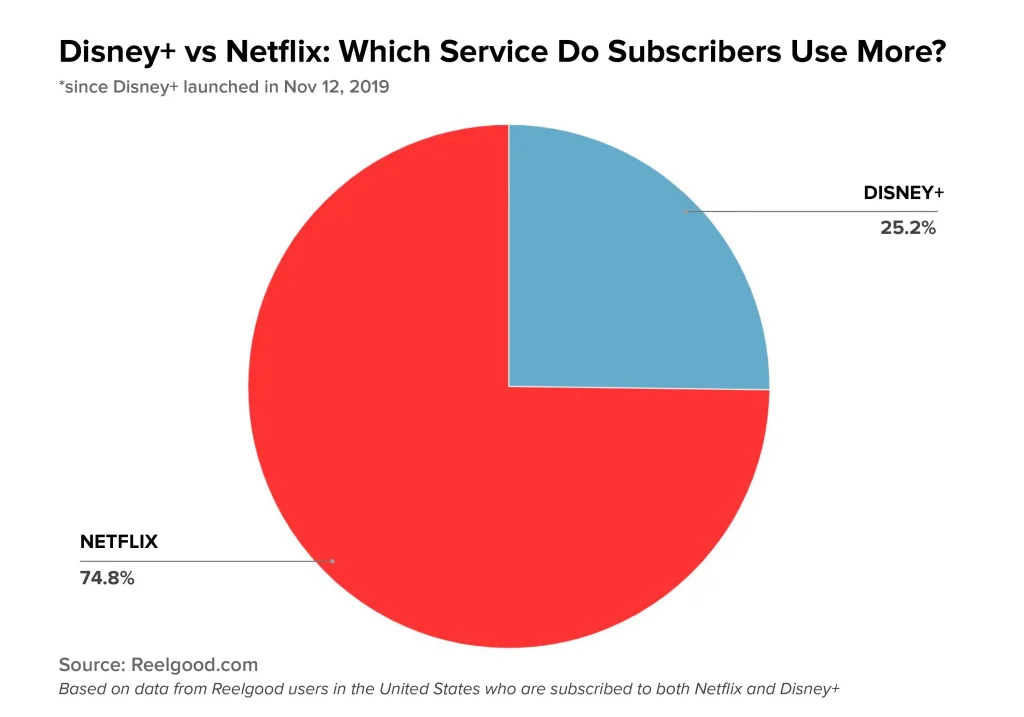
Netflix vs Disney Plus: Subscribers (2020–2024)
| Year | Netflix (mm) | Disney+ (mm) |
| 2020 | 203.7 | 94.9 |
| 2021 | 222.0 | 129.8 |
| 2022 | 231.0 | 152.1 |
| 2023 | 247.2 | 146.7 |
| 2024 | 269.6 | 158.4 |
Despite Disney+’s rapid early growth, Netflix’s global lead remains substantial.
Summary: Why Netflix Still Leads in 2025
Netflix’s massive success is powered by:
- Consistent Revenue Growth: Crossing $38B annually.
- Innovative Monetization Models: Including ad-supported subscriptions.
- Global Expansion: Especially in Asia-Pacific and EMEA.
- Content Dominance: Billions poured into original and exclusive shows.
- Subscriber Retention: Low churn compared to peers.

What to Expect Beyond 2025?
Netflix’s roadmap includes:
- AI-generated localized dubbing
- Expansion into cloud gaming
- Interactive and live content experiences
- Tiered subscription model improvements
With a forward-thinking strategy and a loyal user base, Netflix’s best years might still be ahead.
Netflix FAQ
Q1. What is Netflix’s total revenue in 2024?
A: Netflix generated approximately $38.2 billion in revenue during 2024, driven by global subscriber growth and the success of its ad-supported plan.
Q2. How many subscribers does Netflix have in 2025?
A: As of early 2025, Netflix has over 269 million subscribers worldwide, with strong growth in Asia-Pacific and Europe.
Q3. How much does Netflix spend on content?
A: Netflix spent around $17.5 billion on original and licensed content in 2024, maintaining its dominance in the global content war.
Q4. Is Netflix still the leading streaming platform?
A: Yes, Netflix remains the most popular paid streaming service in 2025, outperforming rivals like Disney+ and Amazon Prime in revenue and subscribers.
Q5. How profitable is Netflix in 2024?
A: Netflix reported a net income of $6.7 billion in 2024, showing strong profitability and efficient cost management.


